What is it like to live on Mars time?

Stressful, according to “Choosing Mars Time: Analysis of the Mars Exploration Rover Experience” by Deborah S. Bass, Roxana C. Wales, and Valerie L. Shalin. Almost certainly, one would adjust quite easily to a Mars-length day (24 hours + 39 minutes) if it were synchronized to the rest of the planet. But as the Mars Exploration Rover scientists and mission operators discovered, keeping Mars time on Earth plunges you perpetually into jet lag limbo.

The decision was made to run MER mission operations on Mars time so that personnel could be synchronized with the rovers’ wake/sleep cycles. They slept while the rovers were awake, and they were awake in turn to receive the latest data and make plans for the next sol’s commands to send back, while the rovers slept. This meant that for those on Mars time, each “day” rotated 39 minutes forward relative to local Earth time — as if they were gradually sliding westward almost (but not quite) one time zone per day. To help with the time-shifting, the buildings were outfitted with black-out curtains and cots and irregular (to Earthlings) meal service. My favorite touch: personnel were given special watches designed to tick off 24:37 per day instead of 24:00.

However, the bizarre schedule was challenging not just due to fatigue and physiological issues but, as the authors discuss, sociological ones, like maintaining connections to friends or family members, or figuring out how to pick up your child from school when (by your calendar) that pick-up time moves 37 minutes earlier each day! An extra complexity arose from the fact that the two rovers, Spirit and Opportunity, were on opposite sides of Mars — so there were actually two different Mars times observed during the mission, depending which rover you were supporting.

Although efforts were made to provide reasonable meal service, it wasn’t perfect:

“Operations staff occasionally were confused about whether the [food] cart would be present when they had a break as they were tracking multiple clocks simultaneously as well as working a schedule that did not follow the normal workday/weekend cycle.”

But there was one reliable source of calories: ice cream.

“Free ice cream, provided as a reward for a successful mission, was also available to the team at all hours. Because the ice cream was easily available, operations personnel ate more of it than they would have normally (3-5 ice cream bars/day was not unusual). Some people gained weight. There is anecdotal evidence that team members relied on the ice cream as both a reward and a pick-me-up to push through the harder parts of their shift work.”

I’ve been told that personnel also wore biometric devices, to track blood pressure, heart rate, and so on. This was a grand experiment from the human physiology perspective: 250 people living with an altered clock, for 90 days, and not in isolation but instead while trying to perform their jobs and live their regular lives as much as possible. I haven’t yet identified a paper analyzing that data or reporting on the conclusions, but I’d love to find such a thing!

You can kickstart Science!

I’ve been impressed with what folks have been able to do at Kickstarter, raising funds to create a product they believe in. In contrast to venture capital or other business investors, Kickstarter contributors are consumers; a vote to support your startup process is a vote for your product. This seems to work well on both sides: consumers get a low-risk way to “shop” for innovative products, and inventors can simultaneously raise funds and test the waters in terms of demand.

So I was intrigued when I came across a Kickstarter-like site… for scientific research projects.

iAMscientist allows researchers to post descriptions of their projects, and interested members of the wider community can pledge funds to support them. Goodbye to lengthy, dense proposals to agencies such as the NSF, NASA, or NIH! Rather than getting your project funded by review from your scientific peers, you instead pitch it to woo the general public.

I can see merits in exposing the public to new ideas, and getting them personally involved in a way that’s just not possible when the projects are paid for by their tax dollars. But can this actually work? It’s not clear to me that people will be as excited about supporting research as they would be about, say, an e-paper watch.

So what interested me most was what these researchers had come up with in terms of “rewards” for donations, since they lack a tangible product. What is it about what I do, day-to-day, that could be commoditized anyway? The rewards for Bridging Scales in Biology From Atoms to Organisms include a signed thank-you letter, a signed preprint of the resulting scientific paper, a personal lab tour or seminar, acknowledgement in the paper, and patent options. Wow! It had never occurred to me that my autograph on a paper I wrote could be of value. :) And it’s interesting how some of these things (like a lab tour) are things you would expect as a matter of course, if you were to visit, as a researcher yourself. I guess that access is something the general public might be willing to pay for—or at least, that’s Dr. Shakhnovich’s assumption!

My favorite is the reward offered for a $64,000 donation by Dr. Pollack, the chair of the Computer Science department at Brandeis University, for his GOLEM project:

$64000: Endow the lab email and web server.
Half the donation will go to to the research and the other half will endow a permanent fund in the university endowment to provide $3200 per year to maintain and upgrade a server — in perpetuity — upon which my lab will host its website “www.Yourname.Brandeis.edu”. I will personally adopt a new email address thusly: “Pollack@Yourname.brandeis.edu”, and I send and receive a LOT of email!

What are you waiting for? Get out there and support science!

Peanuts are “heart healthy” — maybe

Today I noticed this text on my jar of peanuts:

Scientific evidence suggests but does not prove that eating 1.5 ounces per day of most nuts, such as peanuts, as part of a diet low in saturated fat & cholesterol & not resulting in increased caloric intake may reduce the risk of heart disease.

Got that?

The phrasing might make one think that peanuts are also low in saturated fat. But according to my jar, 1.5 ounces of them provides 3 grams of saturated fat, or 15% of your US RDA. So as long as that handful of peanuts is only 1/6 of your daily fat consumption, does that count as “low”? Notice you are also not permitted any increase in calories consumed, so if you add the peanuts, you have to take away 260 calories of something else. Or maybe not.
The Peanut Institute (yeah) goes further, calling peanuts “cardioprotective”. Potentially biased sources aside, there does seem to be a pile of studies out there connecting peanut “and tree nut” consumption to decreased heart risk factors (here’s just one). But the waffly nature of the wording struck me as odd.

Although I just noticed it, the FDA approved this “qualified” notice for peanuts in 2003. From the University of Nebraska’s Food Reflections newsletter:

A “qualified” health claim means FDA evaluated the data and determined “though there is scientific evidence to support this claim, the evidence is not conclusive.” A qualified health claim is issued by FDA when it is determined that consumers will benefit from more information on a dietary supplement or conventional food label concerning diet and health even though the claim is based on “somewhat settled science rather than just on the standard of significant scientific agreement, as long as the claims do not mislead the consumers.”

“Somewhat settled science”? Does this mean that there are studies that found different outcomes? I wasn’t able to find any in a quick search of google and google scholar. However, searching for “FDA” and “peanuts” alerted me to a 2009 salmonella outbreak in peanut butter.

I’m also annoyed by the phrasing “most nuts, such as peanuts,” given that peanuts are legumes, not nuts. It *does* seem to be the case that they’re associated with tree nuts in the relevant studies, but still, it’s irritating to see this miscategorization deliberately perpetuated. Would it have been so hard to say “most nuts, as well as peanuts”?

The circle of fifths just blew my mind

In tandem with violin practice, I’m working my way through Practical Theory Complete: A Self-Instruction Music Theory Course. It starts out REALLY basic, with simple notation and rhythms, but works all the way up to composing your own song (!). I just hit lesson 39 (of 86) and my brain exploded.

I’d heard about the “circle of fifths” before, but had never delved into what it actually meant. What it provides is a nifty arrangement of the various (major) keys, anchored by the key of C, that reveals patterns in the progression of sharps and flats that comprise each key’s signature. Check out this awesome magic:

Starting from the key of C, if you go up a fifth, you reach G. The key of G introduces one sharp, F#. Up another fifth from G, you get D, which in addition to F# also features C#. And so on. (The order of keys G-D-A-E are easy to remember for violin players, since those are the four fifth-separated strings on the instrument.) Going down from C a fifth, you get F. The key of F introduces one flat, B♭. Down another fifth is the key of B♭, which adds E♭. And so on.

This defines a linear relationship between C and the keys “above” it as well as “below”; but positioning them on a circle reveals a bit more of the magic: three of these keys are redundant (or “enharmonic”: they sound the same but are notated differently). This diagram shows that G♭ and F# are the same key; my workbook’s diagram also shows that D♭ and C# are enharmonic, as are C♭ and B. And hey, look on any keyboard and what do you see? These key pairs are, in fact, literally the same key.

Want more magic? What’s going on here is modular arithmetic! Not mod 7, but mod 13: the set of values includes { C, C#, D, D#, E, F, F#, G, G#, A, A#, B, B#, C }. For each key, the major scale is traditionally given as WWHWWWH, where W = “whole step” and H = “half step”. But let’s instead view a scale starting on x as the sequence

{ x, x+2, x+4, x+5, x+7, x+9, x+11, x+12 }.

So the key of C contains { C, D, E, F, G, A, B, C }; C+12 = C in this modular land. Now if we go up a fifth and examine the key of G, that’s the same as adding 5 to all entries. The key of G is therefore
{ C+5, D+5, E+5, F+5, G+5, A+5, B+5, C+5 } which yields
{ G, A, B, C, D, E, F#, G } after doing the addition mod 13.

That is, it’s as if we jumped 5 items forward, but then the extra whole-step in the second tetrachord threw off the pattern and caused the F to become an F#. If you move on to the key of D, the first four notes again are unchanged (with respect to the key of G): { D, E, F#, G }, but then we have to shift one note in the second tetrachord again, yielding { A, B, C#, D }. In this way, the sharps keep building on themselves, and the new sharps introduced in each key alternate. The sharp order is F#, C#, G#, D#, A#, E#, B# (see the pattern?). A similar process explains the progression of flats going “down” from C.

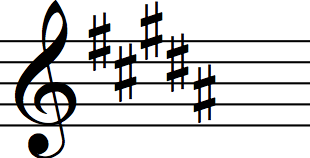
This relationship seems also to explain the conventional structure in how key signatures are written. The key of B major has five sharps, which are C#, D#, F#, G#, A# if you write them in ascending order, but F#, C#, G#, D#, A# if you write them in this circle-of-fifths-inspired order. And that seems to be just what one does (see right).

Patterns! Math! Music! And of course, at the heart of this magic is… physics. :)

Did Viking find life on Mars?

The 1976 Viking landers conducted a handful of experiments that involved injecting a nutrient-laden solution into Martian soil, then measuring gases given off in response. Indeed, gases were observed from the regular soil, but not from soil that was first heated to 160 C (sterilized). That seemed intriguing to many scientists—but others noted that the same result could be obtained through (abiotic) chemical oxidation triggered by the application of water. If I understand the arguments, heating the soil would break down the presumed oxidizer in the soil so it would then react less or not at all to a new injection of moisture.

But lo and behold, the scientists who (still) insist that Viking found life have published a new paper: “Complexity Analysis of the Viking Labeled Release Experiments” by Bianciardi, Miller, Straat, and Levin. They’ve used “complexity variables” to characterize the time series data, then clustered them (with k-means clustering, k=2). Indeed, they found that presumed “active” samples (including some examples from Earth) clustered together while presumed “inactive” samples (including some controls from Earth) clustered in a different group.

Since my dissertation was on clustering, I thought I should take a look and see how this machine learning method was being used in this setting. And, well, I’m just not convinced. Yes, they do seem to have gotten two distinct populations. But they only used 15 samples (11 from Mars, 4 from Earth) and that hardly seems sufficient to characterize the range of behavior, nor are they all obviously comparable (one time series consists of “core temperature readings taken every minute from a rat in constant darkness”; how is this related to possible bacterial activity in soil? Is darkness relevant? What about a rat in daylight, or a diurnal cycle?). The authors have agreed that more data would be better. I think more data, and thoughtfully chosen, would be essential.

My other reservation is about the “complexity variables” that were used. These are presented with no justification or discussion:

  • LZ complexity
  • Hurst exponent
  • Largest Lyapunov exponent
  • Correlation dimension
  • Entropy
  • BDS statistic
  • Correlation time

Especially since these generated the 7D space in which the clustering happened, it’d be nice to have some intuition about why these might relate to life. There are some brief comments about life being “ordered” and of “high complexity” (and I’ve worked on this subject myself!) but I’m not convinced that the distinction they found is truly meaningful.

I don’t want to be unscientifically biased or negative. The results as presented in the paper do seem to show a quantitative separation between active and inactive samples. But this should be conducted with hundreds or thousands of samples from the Earth at the very least, where we have tons of examples of life-bearing soils as well as artificial or sterilized samples. These could fill out the feature space and properly position the Viking observations in more context.

Of course, it would also be useful to get more Martian samples!

Older entries »