When thunderstorms get in your way (in flight)
April 3rd, 2023 at 6:31 pm (Flying, Weather)
On March 22, I went up for some practice instrument flying with a fellow instrument-rated pilot. We headed up to McMinnville (KMMV), about a 30-minute flight. There were a few puffy clouds scattered around, but (somewhat disappointingly) nothing directly in our path, so Ryan put on his foggles and I served as the safety pilot. I watched for traffic, kept an eye on the scattered clouds, and enjoyed the view, while Ryan had to stare at the instruments and miss all the scenery.
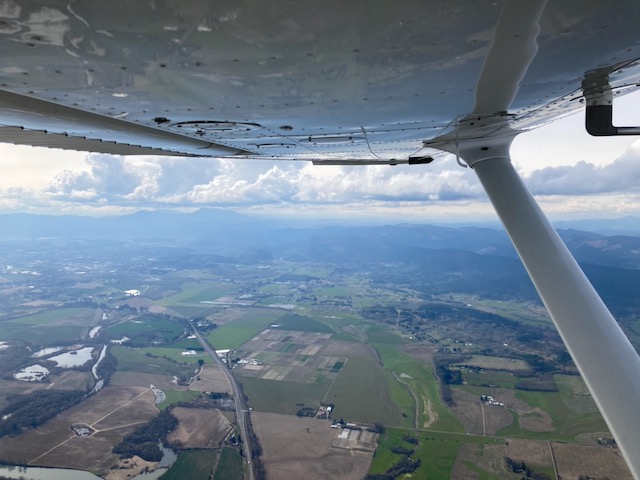
Here’s my view of some puffy clouds away to the west (Ryan flies from the right seat):
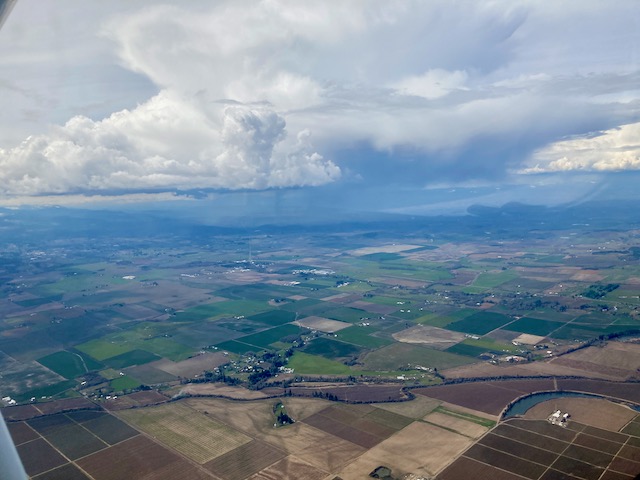
As we flew further north, I spotted this less friendly looking cloud with vertical development and active rain. I kept an eye on it, but we were flying well to the east so it wasn’t an immediate concern.
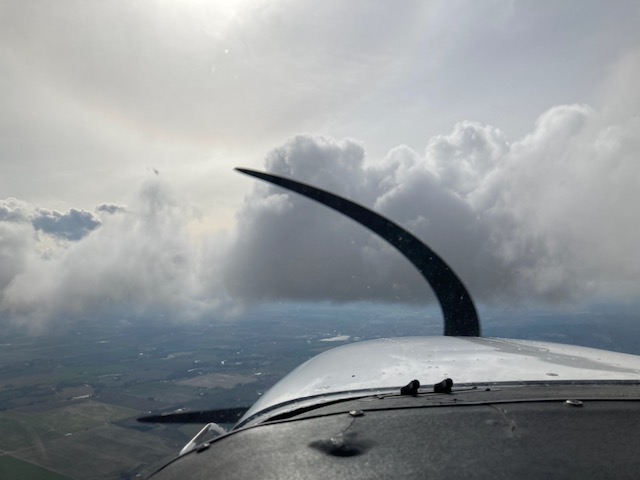
We reached McMinnville (which was clear) and Ryan flew two approaches under the hood while I continued spotting other planes and monitoring clouds to the south and west of the airport. Originally we were going to switch so I could also fly an approach, but it seemed to me that the weather was closing in a bit so we decided to head back to Corvallis. As we returned, Ryan got to fly us into this little cloud (isn’t it stunning?) and then we were clear again.
I took the controls (and the comm), lowered my foggles, and we were cleared back to Corvallis. Now Ryan was scouting for traffic and clouds. At one point he said we’d gotten back in some clouds, so I got to flip up my foggles and enjoy seeing clouds in front of the plane’s nose (I bet that sight never gets old!). Then I was back to staring at the instruments. This was the first time I’d used this plane’s autopilot, and it was a good chance to get familiar with its operation.
After a bit, ATC notified us that there was an “area of severe precipitation ahead, 10 miles wide, say intentions.” That didn’t sound good, and when we tuned in to Corvallis’s weather reporting, we heard “wind 290 at 13 gusting 20, thunderstorms”. We looked at the NEXRAD display and saw that the thunderstorm was sitting just east of our destination (here, south is up and the storm is the yellow/orange blob) – right where we wanted to go to land on the runway most favored by the winds (RW 28).
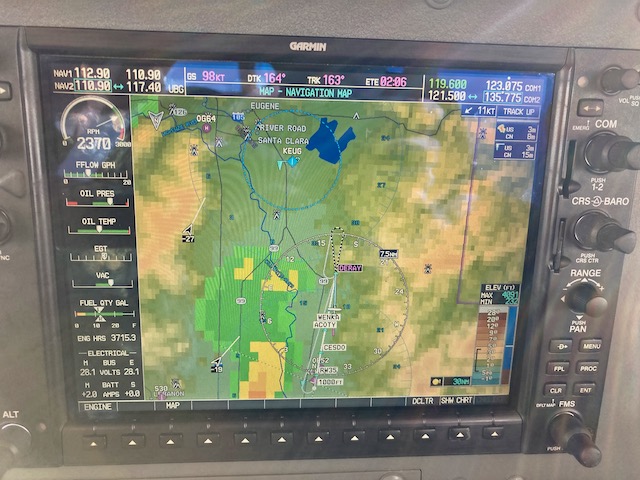
We may fly into clouds, but we do not fly into thunderstorms. I’ve rescheduled a return flight before to avoid them. I’ve never had to deal with them in flight, though. After some discussion of options, I asked for a hold at DERAY, which is a waypoint on the RNAV 35 approach and looked to be far enough south to keep us well clear of the storm. The lines on the screen aren’t our track – they’re the approach, which would take us uncomfortably close to the storm. The hope was that if we circled in the hold at DERAY for a bit, the storm would move on or dissipate, clearing the way for our approach. We had plenty of fuel for this. And indeed, after 10-15 minutes in the hold, the storm had faded and I proceeded in and down towards runway 35. It wasn’t my best approach (I was too high, but better than being too low I guess! I’ll do better next time), but I successfully crabbed into the crosswind and then circled to land on 28 (winds were from 290 at 19 gusting 23, whee). That was my 75th instrument approach!
While everything worked out fine, I was a little perplexed that this thunderstorm came as a surprise. I’d gotten a weather briefing, and there were no thunderstorm warnings (otherwise I would not have flown that day). The only clues were an area of “general convective activity” over most of western Oregon, with no supporting details, and “rain showers” forecast (but rain showers do not always, or even usually, turn into thunderstorms).
After the flight, I looked up the hourly weather reports from Corvallis that had been ticking by while we were out at McMinnville. When we left at 2:30 p.m., winds were from 140 at 7 knots, clear skies. At 3 p.m. it was reporting “LTG DSNT N” (distant lightning to the north). Later reports show the thunderstorm beginning at 3:45 p.m. and ending at 4:41 p.m. We landed at 4:51 p.m.
I also considered what I would do differently if this came up again. I would have asked ATC for vectors to keep us further west of the storm on our way to DERAY. I didn’t notice any turbulence from it, but the standard advice is to stay 20 NM away, and we were closer than that. And if the storm didn’t move or dissipate, we could have diverted to Eugene, which was experiencing clear weather and is quite close.
Overall, this was another reminder that no matter when and where you fly, there’s always something new to learn. Flying is never boring, and I love the continual challenge of it!


