Kepler’s challenges

The Kepler mission has already reported a slew of fascinating discoveries, including new planets and new kinds of planetary systems, and there is every expectation that in the final two years of observations it will continue to reveal more and more planetary treasures. However, no mission or instrument functions exactly as expected, and Kepler has had its share of challenges in collecting and processing its data. “Overview of the Kepler Science Processing Pipeline” by Jenkins et al. (2010) provides a fascinating behind-the-scenes look at some of these obstacles and their solutions.

Kepler consists of a one-meter telescope that has been staring at the same patch of sky for two years. Its goal is to measure the brightness of 156,000 stars every 29.4 minutes (“long-cadence” observations) and a smaller set of 512 stars ever 58.85 seconds (“short-cadence”). Each star generates a light curve of its brightness as a function of time. Exoplanets are detected as slight drops in the brightness while the planet transits in front of the star. For this light curve to be usable for detecting planets, Kepler needs two things: 1) a stable pointing so that the stars don’t bounce around or smear, and 2) a stable sensitivity so that any perceived brightening is due to an actual change in the stars.

During the first few months of observations, the first requirement was challenged. Kepler uses a set of “guide stars” to help fine-tune its pointing, and unfortunately it turned out that one of the guide stars selected in advance was an eclipsing binary. Whenever it would eclipse (so one star hid the other one), its brightness dropped and Kepler lost lock on it. As a result, the pointing was slightly off for 8 hours every 1.7 days (!). Kepler only downlinks its data once a month, so it took a few months to notice and correct this. The eclipsing binary star was eliminated from the guide star list and this problem has gone away.

The telescope is very sensitive to thermal conditions, any changes in which can wreak havoc with its focus. One of Kepler’s RWAs (reaction wheel assemblies, used to point the spacecraft, e.g., to pivot it towards Earth for data downlink and back to resume looking at the stars) has a heater that inadvertently modifies the telescope’s focus by about 1 micron every 3.2 hours. There’s no way to fix this, so it just has to be modeled and removed from the data in processing. Likewise, the spacecraft has experienced two “safing” events in which most of its systems shut down, which cools the entire assembly; each time when operations resumed, it took five days for the thermal effects to disappear from the data.

Perhaps most challenging is an artifact that manifests as “Moiré patterns caused by an unstable circuit with an operational amplifier oscillating at ~1.5 GHz.” Luckily, the actual impact on the data values is very small, generally only perturbing them by a single increment, but it is virtually impossible to adequately model and remove, so no doubt a source of at least minor frustration:

“Given that the Moiré pattern noise exhibits both high spatial
frequencies and high temporal frequencies, the prospect of reconstructing a high-fidelity model of the effects at the pixel level with an accuracy sufficient to correct the affected data appears unlikely. We are developing algorithms that identify when these Moiré patterns are present and mark the affected CCD regions as suspect on each affected LC.”

And finally, there was a curious overall brightening (termed “argabrightening”) observed in early phases of the mission. About 15 times per month, the background brightness of the entire field increased dramatically for a short time. The current hypothesis is that this was caused by remnant dust particles coming loose from Kepler and floating off, then reflecting sunlight back into the telescope. Detecting and removing affected observations was crucial for yielding consistent light curves. Fortunately, the rate of these events has decreased over time (Kepler might be running out of dust).

I look forward to more fascinating news from this great mission! And I hope they keep sharing the interesting challenges and lessons learned from operating a telescope from so very far away.

Bilingual exoplanet coverage

Others in my French Translation class have chosen works of literature for their translation projects. Me? I chose a recent article announcing a terribly exciting discovery: the first rocky exoplanet! (As opposed to the “hot Jupiters” and other large gaseous planets.) I found this article on the radio-canada.ca website:

Une première exoplanète rocheuse
(16/9/2009)

Près de 15 ans après la découverte de la première exoplanète en 1995, des astrophysiciens européens ont annoncé avoir trouvé une toute première planète de type rocheuse autour d’une autre étoile que notre Soleil. L’exoplanète Corot 7b avait été observée en début d’année, mais sa composition n’avait pu être établie à ce moment. Sa constitution n’est pas l’unique particularité de Corot 7b. Elle est également la plus petite jamais découverte, avec un rayon équivalent à 1,8 fois celui de la Terre. De plus, c’est la planète la plus proche de son étoile. Elle en fait le tour en seulement 20 heures (correspondant à la durée de son année). Le spectrographe HARPS installé sur le télescope européen de 3,6 mètres de la Silla, au Chili, a également permis d’établir que sa masse correspondait à 4,8 fois celle de la Terre.

Vie impossible
La température dépasse 2000 degrés Celsius sur la face éclairée, puisqu’elle est située à seulement 2,5 millions de kilomètres de son étoile. L’astre pourrait avoir des océans de lave à sa surface. L’autre face, plongée dans la nuit, est glaciale, avec des températures qui plongent sous les -200 degrés Celsius. À titre de comparaison, la Terre tourne à 150 millions de kilomètres du Soleil.

En avril dernier, Gliese 581e avait été présentée comme la plus petite exoplanète. Les découvreurs de Corot 7b estiment que seule la masse de cette dernière est connue, ce qui n’est pas le cas pour Gliese 581e.

Even though my French Translation class is obviously in the humanities, I was a little surprised at some of the students’ reaction to this article — it clearly was perceived as a bit out of place! However, several people commented on how they learned a lot from it: some didn’t even know that we’d discovered exoplanets (!) and others did additional research, reporting (correctly) that we’ve discovered more than 300 of these bodies! So I guess it turned out to be an unexpected chance to sow a little science, and alert others to one of the most amazing advances we’ve made in the last couple of decades (in my humble opinion).

But without further ado, here is my translation:

The first rocky exoplanet

Nearly 15 years after the discovery of the first exoplanet in 1995, European astrophysicists announced that they have found the very first rocky exoplanet around a star other than our Sun. The exoplanet Corot 7b was observed at the beginning of the year, but its composition could not be established until now. Its composition is not Corot 7b’s only distinction. It is also the smallest ever discovered, with a radius equivalent to 1.8 times that of the Earth. Moreover, it is the planet closest to its own star. It orbits in only 20 hours (corresponding to the length of its year). The HARPS spectrograph installed on the 3.6-meter European telescope at La Silla [an observatory], in Chile, has also established that its mass corresponds to 4.8 times that of the Earth.

Life is impossible
Temperatures exceed 2000 degrees Celsius on the illuminated side, since the planet is located only 2.5 million km from its star. The planet* may have oceans of lava on its surface. The other side, plunged into night, is icy, with temperatures that drop to less than -200 degrees Celsius. For comparison, the Earth orbits at 150 million km from the Sun.

Last April, Gliese 581e was presented as the smallest exoplanet. The discoverers of Corot 7b consider mass to be [definitively] known only for Corot 7b, and not for Gliese 581e.

*The word “astre” is translated as “star”, but that makes no sense here; it should be “planet”.

I must say, that final sentence gave me the most trouble! Suggestions about other ways to phrase it are certainly welcome.

In class, we discussed my translation, and I received several suggestions about ways to improve it:

  • “à ce moment” should have been translated as “at that time” rather than “until now.”
  • Consider “duration of its year” rather than “length of its year.”
  • Consider breaking the final sentence of the first paragraph into two sentences, as it is rather unwieldy.
  • Consider changing “The other side, plunged into night” to simply “The dark side” (for clarity over poetry). I disliked “plunged” myself, because it sounds overly dramatic. If wishing to stick closer to the original, someone else suggested “The other side, immersed in night” (less sense of active motion).
  • Apparently “À titre de comparaison” is a stock phrase that means “By way of comparison,” although “For comparison” also works (is probably less formal, though).

After class, I checked how Babelfish and Google Translate rendered this text into English. The Babelfish version is heart-stoppingly bad, beginning with

“Nearly 15 years after the discovery of the first exoplanète in 1995, of the European astrophysicists announced to have found a very first planet of the rock type around d’ another star that our Sun.”

It’s not terrible that Babelfish doesn’t know the word “exoplanète”, but its inability to handle contractions throughout the article is really inexcusable, especially for French! Google Translate’s version is consistently better, but not perfect. The first sentence is rendered:

“Nearly 15 years after the discovery of the first exoplanet in 1995, the European astrophysicists have announced to have found a first-type rocky planet around a star other than our Sun,”

but it failed to catch the negation in the second:

“The COROT exoplanet 7b was observed earlier this year, but its composition had been established at this time.”

(Also humorous is its translation of “581e” as “581st” — subtle!)

I guess I am encouraged that there’s still a need for human translators!

Exoplanet discovered by astrometry

Two JPL astronomers have found another exoplanet, which is the first to be found using astrometry. That is, the presence of the planet was inferred by careful study of the host star to detect a very faint wobble (with respect to nearby stars) caused by the planet’s mass as it orbits the star. Unsurprisingly, this detection method works best when the mass of the planet is large relative to that of the star, and indeed, the VB 10 star (a red dwarf) is very small as stars go (1/10 the size of our Sun), and its planet is estimated as being nearly the same size as the star, although less massive. Surprisingly, this may actually be the first time the astrometry technique has borne fruit. All previous claims of planet detection by astrometry could not be verified using other methods. If this one succeeds, it will be the first. The challenge is that extremely high precision and multiple observations over the course of years (ideally, multiple orbits of the planet) are required to detect the extremely small planet-induced stellar motion. In this case, the discovery comes as the result of 12 years of observations by the Palomar Observatory.

You can read more details in the pre-print of the scientific paper, “An Ultracool Star’s Candidate Planet,” by Pravdo and Shaklan. I particularly like Figure 7, in which a Keplerian orbit for the planet is shown, modeled from the collected observations of stellar perturbations. The figure includes both error bars on the observations and lines connecting the observations to the corresponding points on the model. You can even watch a video of the observations of the star’s motion with an accompanying view of where in its orbit the planet would be (although this is a little confusing because the orbit is represented off to the side instead of traveling with the star). The effect is subtle enough, and the observations are spaced far enough apart, that I don’t see it with my eye (even stepping frame by frame), but that’s to be expected. Still, error bars and all, this is a fascinating hint at what might be going on in the vicinity of VB 10, and a definite motivation to obtain followup observations with other techniques (although it is a difficult target for the radial velocity and transit methods since the planet’s orbital plane is likely close to perpendicular from our perspective). The paper notes that it’s possible that other planets lurk in the same system — perhaps even in the habitable zone.

Microlensing for planet-hunting

Clever astronomers have come up with many different, creative ways to detect extrasolar planets orbiting around other stars. We’re up to 346 planets detected now, by a variety of different methods including transit detection, radial velocity analysis, precision astrometry, and direct imaging. At the Missions for Exoplanets meeting today, I learned about another method that relies on serendipity but, when it happens, provides inarguable evidence for a planet.

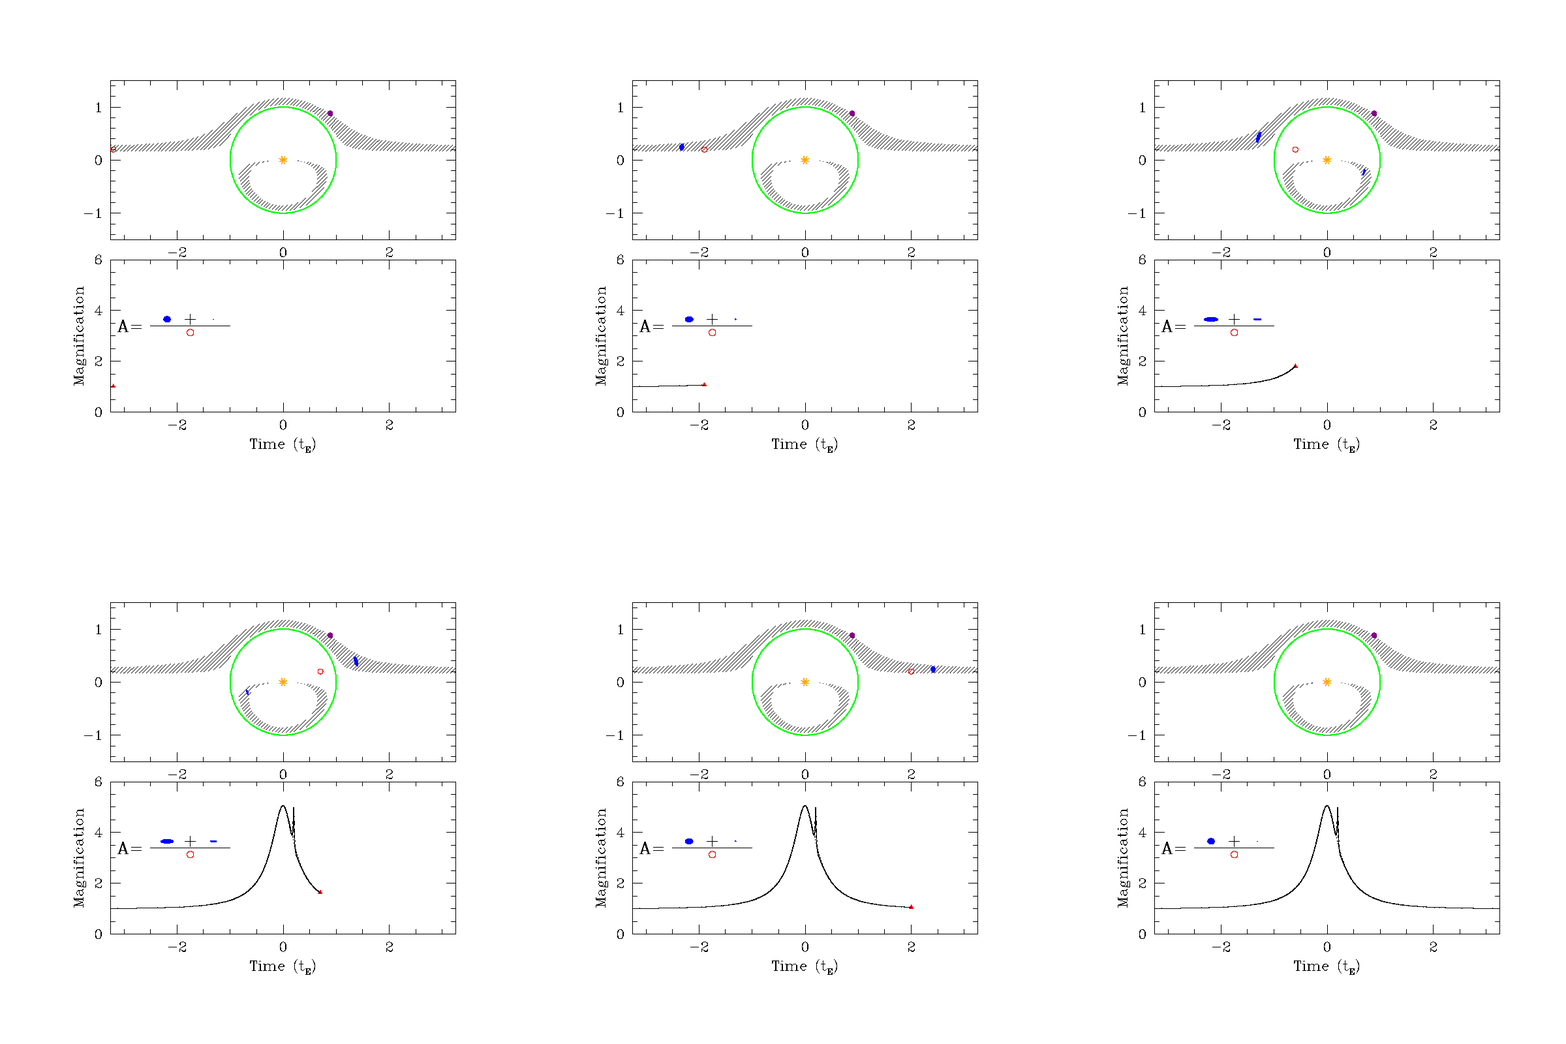
Gravitational microlensing refers to the brief magnification we observe when a dimmer, closer star passes between us and a brighter, distant star. Gravitational effects cause the distant star to temporarily become even brighter (because its light is being bent and focused towards us). If the closer star (the “lensing” star) also has one or more planets, then the resulting light curve gets an extra bump from the planet’s “micro”-lensing effect.

Scott Gaudi of Ohio State University created this marvelous animation of microlensing in action, which also shows how it is detected. (I love the symbolic fraction!) The distant star is the red circle, the closer star is in orange, the distant star’s apparent position is in blue, and the closer star’s planet is the brown dot.

What’s neat about this phenomenon is that although no one yet seems up for predicting when and where it might happen next, as soon as the characteristic increase in brightness begins, teams across the globe are alerted and start watching, hoping to capture the planet’s bump (if any) when it happens. In fact, amateur observers have contributed key observational data that helped find a new planet.

Maybe I should break down and get a telescope already.

Measure the age of the universe

The NRAO (National Radio Astronomy Observatory) offers online what just may be the coolest try-this-at-home project ever. How often do you get to do your own cosmology, with no equipment and no training? Well, now you can, by going through the measure the age of the universe tutorial.

Given the observation that all other galaxies are moving away from us (which is observable due to the Doppler effect, which manifests itself as a redshift in the light they emit), and assuming that other spiral galaxies are about the same size as ours (yes, quite an assumption), then using our current estimate of the size of our galaxy, we can convert the apparent size of another galaxy into its distance from us.

Then, we record the distribution of redshifts coming from the galaxy (different parts will shift by different amounts since some may be spinning towards us and some away) and convert those shifts into a velocity. For precision, we look at one particular wavelength (the radio spectral line of hydrogen, here).

Finally, we plot distance versus velocity to get the relationship between those two variables. Edwin Hubble‘s great discovery, after going through this same process, was that more distant galaxies are more red-shifted, and therefore moving faster — thus, there is some sort of acceleration going on. The slope of a line fit to these data points gives us that acceleration, which is referred to as the Hubble constant, H0. Since this constant (slope) is velocity divided by distance, it has units of 1/time. Therefore, if you take its reciprocal, you get time itself: the age of the universe.

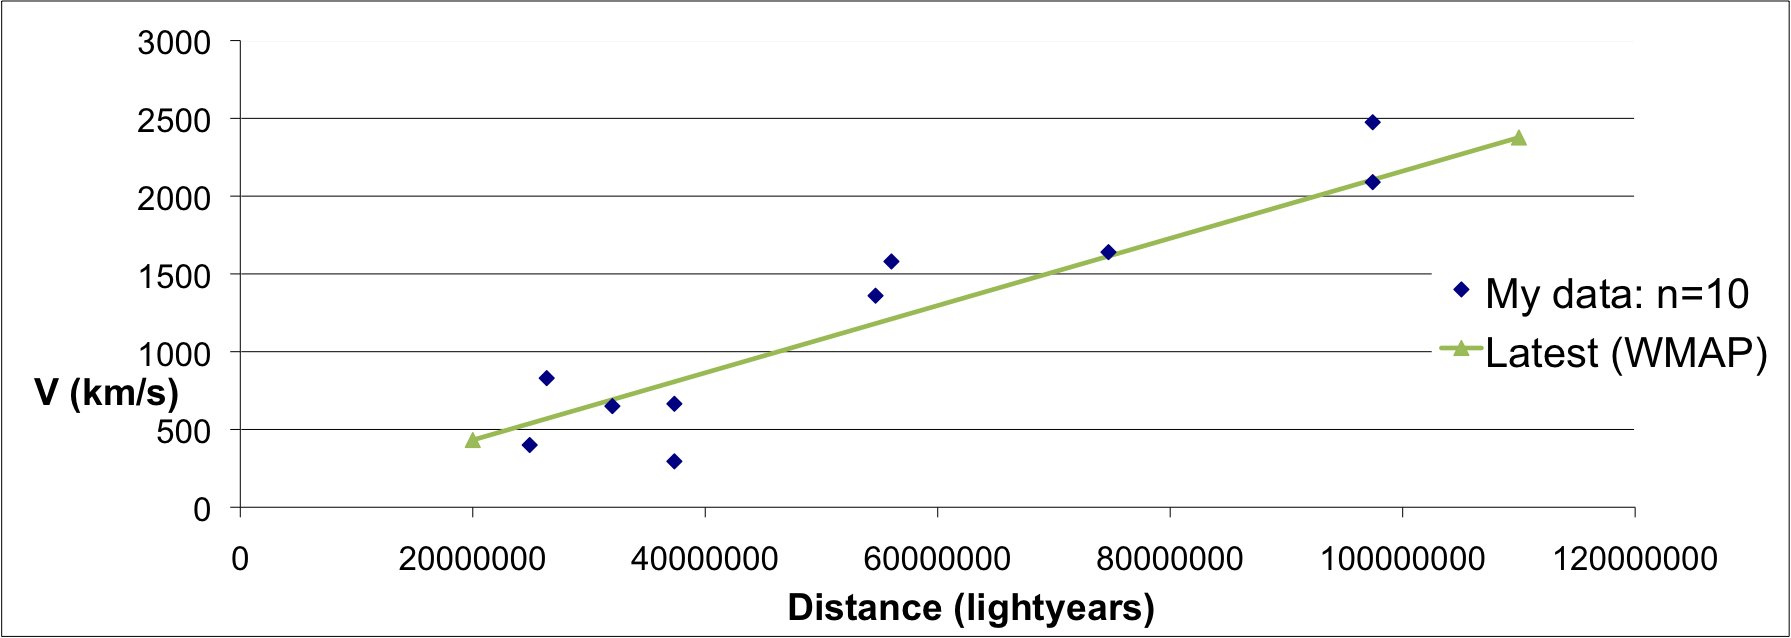
I downloaded the 10 example galaxies provided in the tutorial (and you can, too) and calculated distance and velocity values for each one. I felt more confident in my ability to estimate the velocity (average of the observed values) than for the distance, which is very sensitive to the angular size, which is extremely hard to be precise about with a paper ruler. :) I’m assuming that whoever prepared these examples already adjusted the images so that they all have the same scale. Since not all galaxies are perpendicular to us (some are tilted away), I used the largest diameter I could find. My observations are shown below, plotted against the line obtained using the current best estimate of Hubble’s constant (derived from thousands of observations, not just 10!). While I didn’t get a perfect linear relationship, apparently this isn’t expected due to relativity and other confounding factors. Hubble himself used 46 galaxies and ended up much, much further off (apparently due to “peculiar velocities” and poor calibration on distances).

Each galaxy provides an estimate of the age of the universe. Using these 10 galaxies, my estimates ranged from 10.0 to 39.8 billion years old. Excluding the crazy outlier (NGC 4214, which is the only one with an estimate outside the standard deviation), my estimate of the age of the universe is 14.2 billion years old. Not too far off the latest best estimate of 13.8 billion years!

And what of NGC 4214? It turns out that it isn’t a spiral galaxy at all, which could explain why it didn’t fit with the others. Its redshift indicates that it isn’t going very fast, so shouldn’t be very far away, but it appears to be very small given its proximity. I’m guessing that it’s much smaller than the 10 kpc that was used as the assumed size for all galaxies in this study. In fact, I found that its diameter has been determined to be only 6.7 kpc. So it’s a true outlier, not just due to measurement error.

Science is awesome.

« Newer entries · Older entries »